Great job Wes!
Tuesday, September 30, 2014
Datapad - Acquired!
Great job Wes!
Monday, September 22, 2014
Tuesday, September 16, 2014
Interesting all pairs similarity search paper from Google
 I got a link to this paper by Ira Cohen, Co-Founder and Chief Scientist of Anodot. The paper full title is:
It seems like a simple method which works well when the compared pairs of vectors are sparse. It is also accompanied by open source code.
Friday, September 5, 2014
Machine learning postdoc position in Paris
My colleage Florent Krzakala from the Ecole Normale in Paris is looking for a postdoc in the area of statistical inference and machine learning.
Wednesday, September 3, 2014
First workshop on software engineering for machine learning announced
My colleague Xavier Amatriain from Netflix is organizing this NIPS workshop: first workshop on software engineering for machine learning. Paper submission deadline is October 10. Workshop will be held December 13 as part of NIPS conference.
Tuesday, September 2, 2014
PNNL Cyber Security Project Utilizes GraphLab

Guest blog post by Sutanay Choudhoury, Senior Research Scientist @ PNNL:
There is a growing emphasis on "resilience" in the cyber security community today, signifying a shift from the adversarial detection mentality. Cyber defenders are always at a disadvantage with respect to the attackers due the large number of strategies an attacker may pursue, and sophisticated hackers successfully disguise their behavior as normal activity. Resilience is defined as the ability of an enterprise to keep its infrastructure functioning even in the face of impediments such as attacks, power failures. Our world relies on interconnected data, services, and computing resources. Failure in any part of the system could have disastrous consequences on the rest of the system.
The M&Ms4Graphs (Multi-scale, Multi-dimensional Graph Analytics for Cyber-Security) project at Pacific Northwest National Laboratory, USA uses graph-theoretic models to provide continuous updates on system states as part of enabling a resilient cyber infrastructure. By studying information flows modeled as large-scale dynamic graphs, this project developed a multi-scale framework that can account for behaviors spanning from individual machines to enterprise levels within a cyber system. M&Ms4Graphs uses GraphLab as a major building block in the underlying computation layer. The application has three distinct layers:
1) Graph Models: Building graph models from Cyber data. This layer builds weighted graphs with labeled and attributed nodes and edges from network traffic, event log datasets. Graphs from here feed into (2).
2) Graph metrics: We compute a set of graph theoretic metrics using GraphLab (triangle counting, pagerank, k-core decomposition, SVD) and our own codebase (aggregation, frequent subgraph mining, agglomerative clustering).
3) Cyber metrics: The graph theoretic features from (2) feed into another set of algorithms that are computing more abstract/cyber focused metrics. Examples include algorithms for role mining (learning behavioral models), topological strengthening (recommendations for changing the graph topology), computing network resilience etc.. At this point, this layer is mostly implemented in python/MATLAB.
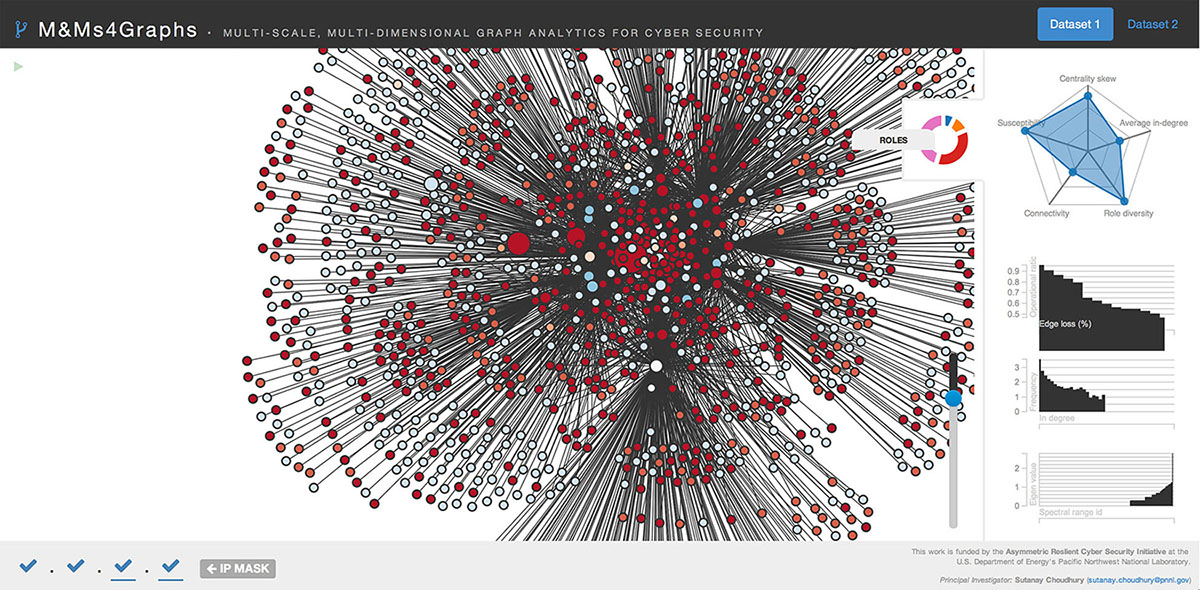
An online demo available at http://goo.gl/1iiqc6, show the machines in a cyber network. The machines are colored by their behavioral profiles, which are gleaned from the data. The polygon on the right summarizes important properties of the underlying data stream.
Subscribe to:
Posts (Atom)